PR Ratings V3
PR Ratings V3 features: everything you get
Here is what PR Ratings V3 can do. I’ll keep this to the things that are in the app today, not a wish list. Every member gets the full software.
Filter cards
Pick from over 100 filters, and use only the ones that interest you. A filter is one rule in your system. For example, “races with 8 to 12 runners”. Each filter is a card. You add a card by dragging it, pressing + or pressing its name.
There are 124 filter cards, in eight groups. A card only changes your results when you set it differently from its usual range. So you can add a card, have a look, and take it off again if it isn’t useful.
Most cards have a From and To setting. Some take a list of names, such as courses or trainers. Some have an Exclude box, so you can leave things out instead of picking them in.
You can search the list. Type “jockey” and you’ll only see the jockey filters. You don’t need to learn all 124. A handful is plenty.
The eight groups
- Race and meeting — runners, course, going, class, distance, prize money, month, weekday and the big festivals.
- Horse — age, official rating, draw, weight, wins, gender, headgear and class, weight or distance moves.
- Jockey and trainer — names, wins, strike rates, and how often they win at the course.
- Prices and ranks — early, 9am, 11am, 1pm, 5pm, 60-minute, forecast and starting prices, plus the ranks at those times.
- Ratings — PR Ratings’ own figures, including the main PR rating and the green rating.
- Tipsters — how many tipsters picked a horse, and where it ranks with them.
- Form and record — last time out, days since it ran or won, course and distance flags, and a form wildcard.
- Staking — two cards that compare chance-of-winning figures at different times of day.
Standing settings
These stay on the screen all the time. They apply to every system.
| Setting | What it does |
|---|---|
| Racecard day | The day for the Today’s races list. It starts at today. |
| Results from / to | The past period that History uses. It starts at one year ago, up to yesterday. |
| Race country | UK, UK and Ireland, or Ireland. |
| Type of bet | Back, Lay, Place, Place lay or Dutch. |
| Handicap | All, Handicap, Non-handicap or Non-maiden. |
| Race type | Flat, Chase, Hurdle, NH Flat and All-weather. Leave them clear to include every type. |
| Based on which price | Early, 11am, BSP, SP, Place BSP, 5pm, 1pm or Forecast. |
| Commission % | The commission rate Betfair charges on your winnings in each market. It’s set to 5% to start with. Change it to your own rate. |
You also set the sort order for runners, and a price range if you want one. Dates and commission are not stored in a saved system. When you open a system, it uses the dates on the screen, so you can test any system over any period.
Today’s races
This is the part most people look at first thing. It lists the runners that fit your system on the racecard day, grouped by time and course.
Each runner shows Time, Course, Horse, Result and Price. You also get one extra column for each card you use. If you use Tipster rank, you’ll see each horse’s tipster rank.
Some prices only arrive later in the day. The 9am prices appear at about 9:15, the 11am prices at about 11:15, and the 11am rank at about 11:30. If you look very early, you may see fewer runners. Nothing is broken. The prices just haven’t got up yet.
Quick Analyse
With Quick Analyse you can spot angles that have done well in the past, within seconds. It takes one filter and splits it into parts, then shows how each part would have done, with your other rules still applied.
On Early rank, each row is one rank. On a price card, each row is a band such as “2 to 3”. You get bets, wins, strike rate and the profit or loss for back, lay, place and place lay.
Tick the rows you like, then press “Use only these in my filters”. The card updates. Press Update results to run the system again.

History
History adds up how your system would have done over the dates you set. It only counts runners that actually raced and have a result. Non-runners are left out.
The main box shows your profit or loss in points. Next to it are your bets, wins, strike rate and return on investment (ROI). You also see the biggest drop in your bank, your longest winning and losing runs, your average prices, and a few more figures, such as profit per day.
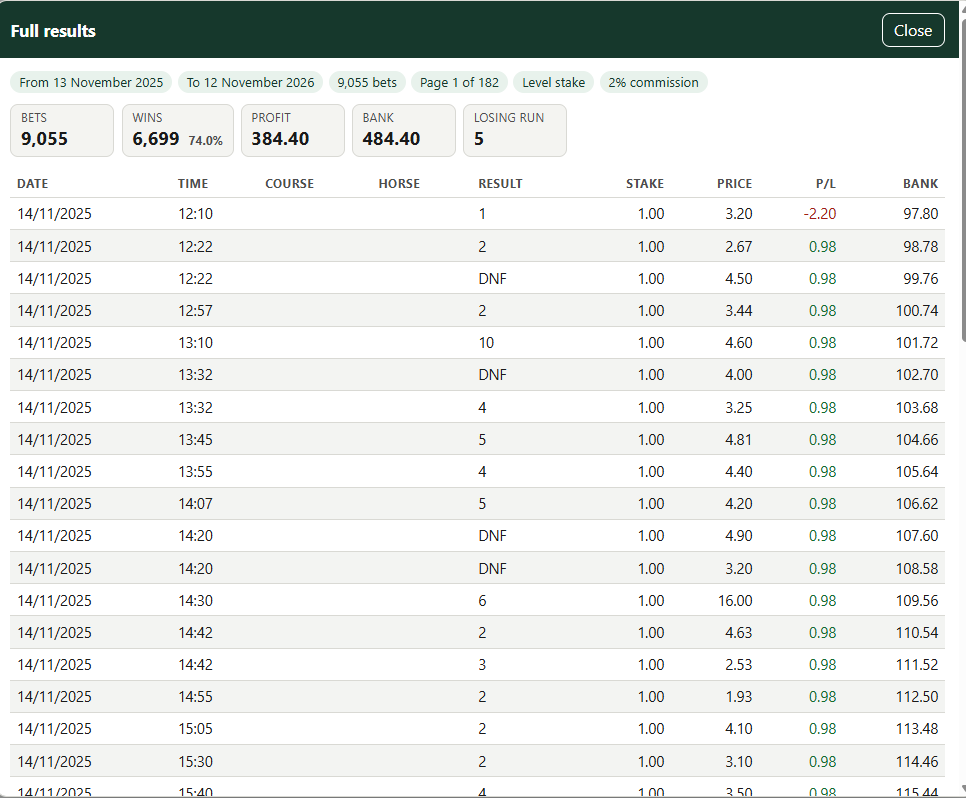
You can press “Show all bet types” to see back, lay, place and place lay side by side. That’s handy when you can’t decide which way to bet. There is a graph of your bank over time, a table for each month, and a Full results window that lists every bet. Figures are in points. If you bet £1 a time, one point is £1. You get a full set of results each day, with BSP and SP. History uses BSP for most of its sums and takes commission off winning bets only.
More figures in the History totals
The History totals also show some figures about the shape of your results, not just the final total.
- Profit factor is your winnings divided by your losses. A figure above 1 means the winnings were bigger than the losses over your dates.
- Recovery factor is your profit divided by your worst drawdown. A drawdown is a drop in the bank from its last high point. So this figure compares the profit with the worst dip on the way.
- Time under water shows how long the bank took to get back to a high after a dip. It also shows how long it has been since the last high.
- Return on liability is for lay systems. When you lay a horse, your liability is the amount you could lose if it wins. This figure shows your profit or loss against that amount.
- Months in profit shows how many months made a profit, the average month and the worst month.
Together, these figures help you see if the past results were steady, or if they rest on a few lucky months.


Does it hold up?
Any system can look wonderful after one 50-1 winner. This check tries to keep us honest.
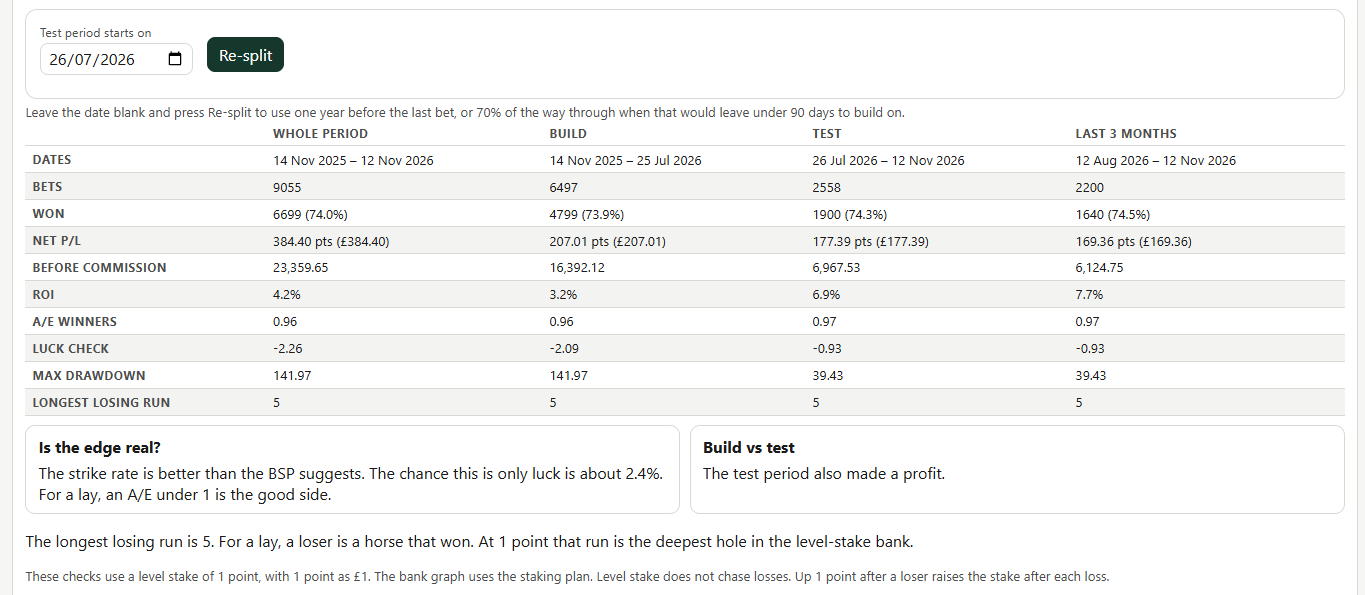
The app splits your period into two parts. Build is the earlier part, as if that’s when you found the system. Test is the later part, which you didn’t shape the system to fit. If it made a profit in both, that’s a better sign than a profit only in the build. You’ll also see a luck check, the longest losing run, and a short verdict in plain words. These checks use a level stake. They are a guide, not a certificate of genius.
The table also shows how much of the build-period return held up in the test period. It shows how A/E changed, too. A/E means actual against expected winners. It compares the winners your system found with the number the prices suggested.
Steady, or a few lucky breaks?
These checks help you see whether a system’s past results are steady, or rest on a few lucky months, courses or big winners.
Rolling ROI
ROI means return on investment. It is your profit or loss as a share of the money you staked. Rolling ROI shows the return over your last 50, 100 or 250 bets, at each point along the way. A chart shows how it moves, so you can see if the return stays fairly level or jumps about.
Leave one group out
This check tests your system again without each month, each course or each meeting, one at a time. So one big festival or one track can’t hide behind the totals. A system that only works at Cheltenham in March is a nice week out. It isn’t much of a system.
Resampled ROI range
The app picks from your own past bets at random to make lots of ‘what if’ versions of your results. It then shows where most of those returns landed. A wide range means your return could have been very different with a bit more or less luck.
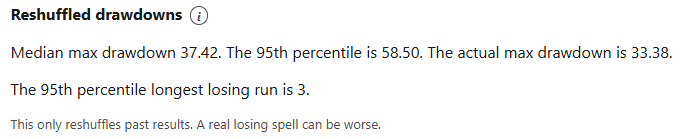
Reshuffled drawdowns
Your bets came in one order. They could have come in another. This check shuffles the order of your past bets many times. It then shows how bad a losing spell could get. Ask yourself if you could live with that.
Run the deeper checks
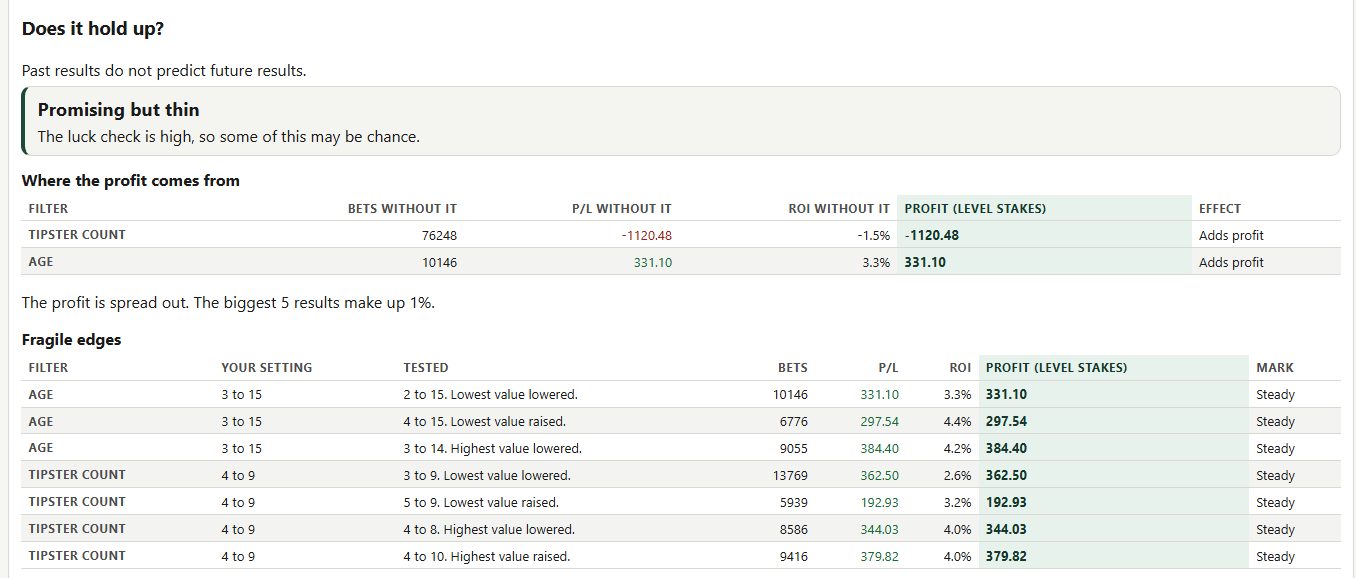
After the build-and-test check, you can press Run the deeper checks. This looks more closely at the filters you have used. It helps you see what is really doing the work, and what is sitting on a knife-edge.
Where the profit comes from
The app runs the same staking again, with one filter turned off at a time. You see the bets, the profit or loss, and the return without that filter.
If the return drops, that filter is doing the work. If you only get fewer bets and the return stays put, the filter is just cutting the number of bets. A short note tells you whether that filter added to the past return, cost it, or made little difference.
Fragile edges
The app nudges each end of a number range by one step. For example, Age 4 to 6 becomes 4 to 7. It then marks your setting Steady or Fragile.
Steady means the return stays within 5 points, and a profit does not turn into a loss. Fragile means a small move knocks it over. That’s your warning that the idea may only work on a knife-edge.
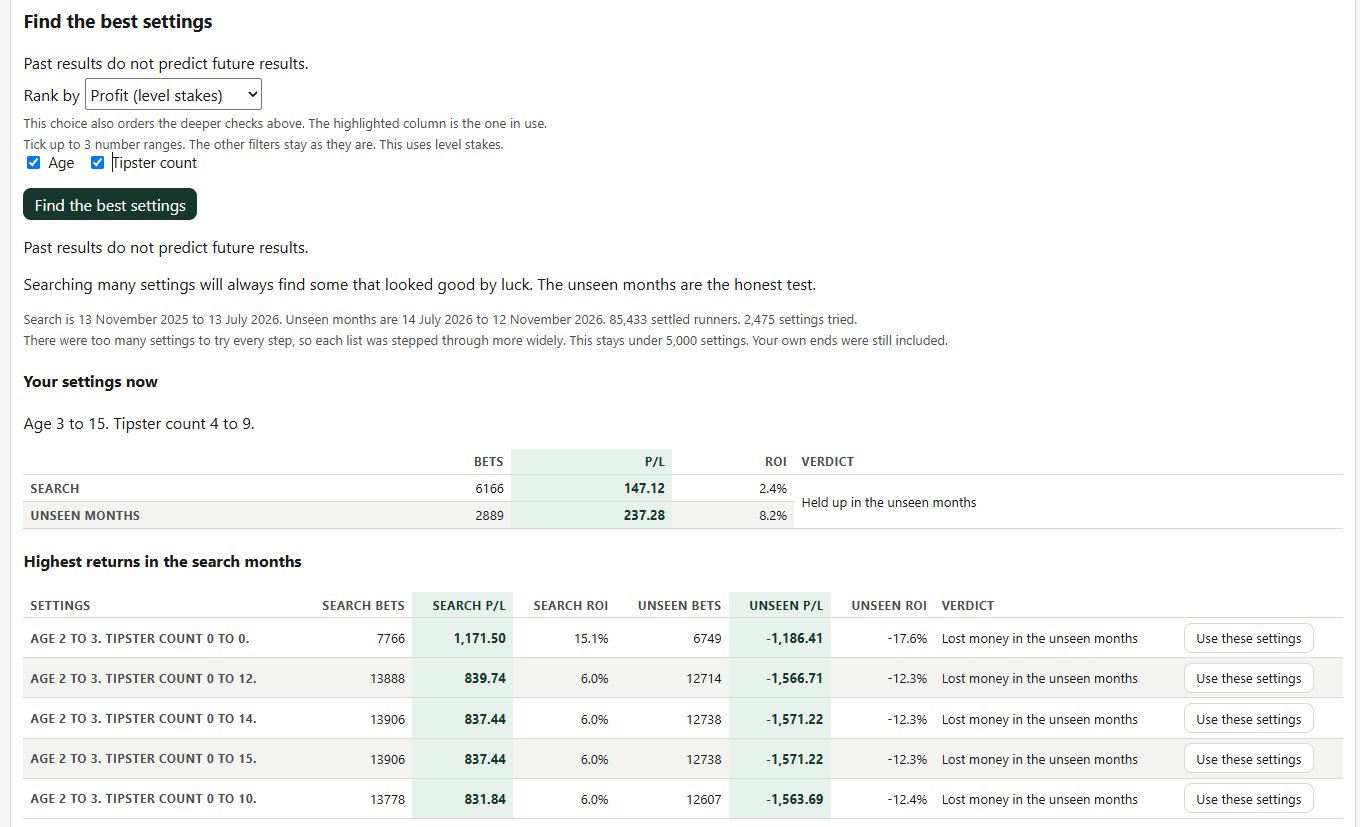
Find the best settings
Trying every number by hand takes ages. Find the best settings does the trying for you.
Tick up to three number ranges, such as Age or Class. The other filters stay as they are. The search uses level stakes, with your type of bet, your commission, your points and your dates.
It uses the first two thirds of your dates as the search months. It keeps the last third back as unseen months, and does not use those months to pick a winner. A setting needs about 100 bets in the search and about 30 in the unseen months.
You can rank the results by profit at level stakes, by return, by strike rate, by profit without the biggest winners, or by how many months made a profit.
You then see your settings now, beside the best settings found in the search months, and how those settings did in the unseen months. The verdict is honest. You may see “Held up in the unseen months”. You may also see “Faded in the unseen months” or “Lost money in the unseen months”. That is the point. A good run in the search is not enough.
If you like a set of numbers, press Use these settings. The cards update. It does not save the system for you. You can still look, change your mind, and press Update results.
Searching many settings will always find some that looked good by luck. The unseen months are the honest test.
Back fitting? Here’s my view
People are always going on about back fitting. Here’s how I see it.
Everything is back fitted until you know the result. Studying form is looking at past results, with some logic, to judge what might happen next. If you use logic when you build a system, you are still studying form. You’re just doing it in a different way.
The trap is chasing every number until the past looks pretty. Have a reason for each filter. Don’t pile on cards just to tidy up last year’s figures. And be wary of an idea with only a handful of bets.
That’s why V3 has the honesty checks above. Does it hold up? splits your dates into a build period and a test period. The deeper checks show which filters really pulled their weight, and whether a setting is Steady or Fragile. Find the best settings tests those settings on months the search has not seen.
Race your system
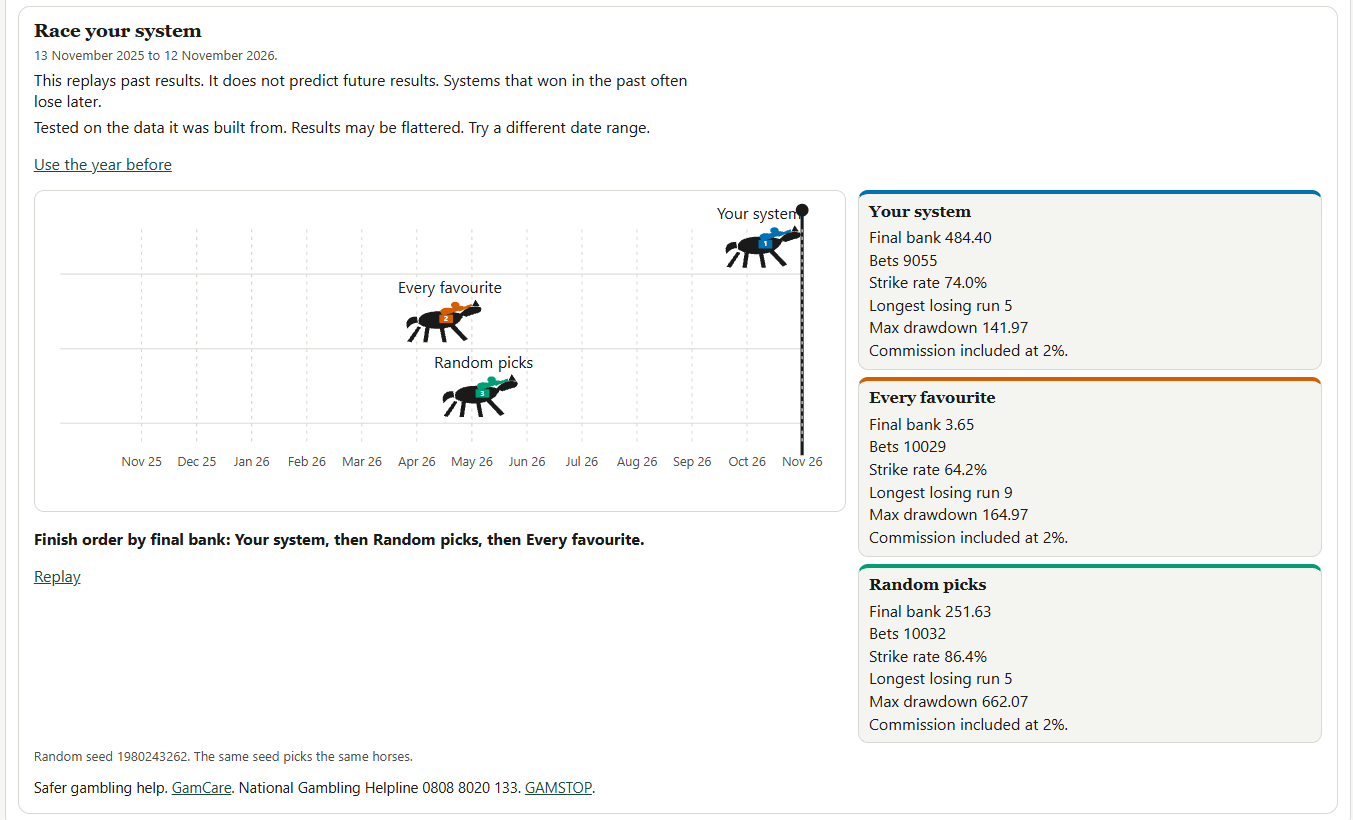
This is the fun bit. Race your system turns your past figures into a short horse race, so you can see how your rules did against two simple comparisons. One horse is your system. One is backing every favourite. One is a random pick in each race — the monkey-with-a-pin test. Press Watch the race in History to start it. It never starts on its own.
The race replays the past. The app also warns you that results may be flattered if you built the system on the same dates. You can press Use the year before for a fairer race. If your system can’t beat a monkey with a pin, that’s worth knowing.
Staking plans
A staking plan is a rule for how much you bet each time. Some plans stay steady. Others try to win losses back faster, and they can bite. You pick a plan in History, set your points and starting bank, then press Update.
For any type of bet
- Level stake — the same amount every time. A calm place to start.
- To liability — on back bets, the stake changes with the price, so a win pays back about your points.
- Up 1 point after a loser — the stake rises after a loser and drops back after a winner.
- Percent of the bank — each stake is a percentage of the bank at that moment.
- Square root of profit — the stake creeps up slowly once you are ahead.
- Stop at a winner — you stop for the rest of the day after a winner.
- Martingale — the stake rises after losers. This can need a very large bank in a long losing run.
- 1326 — the stake rises after winners, then goes back to 1 after a loser or a full cycle.
- Up 1, then stop at the first winner — for back bets. The stake rises after losers. After a winner, you stop for the day.
For lay bets only
- Maria — the stake depends on the price. On prices of 12.0 or more, you don’t bet at all.
- Percent of bank, divided by the price — your liability stays a set percentage of the bank.
- Split the losses — a losing lay is shared over the next few bets.
- Split the losses to liability — the same idea, based on liability.
If you pick a lay plan with a back or place bet, the app uses level stake instead and tells you so.
Dutch is a little different. History does not stake Dutch bets. It shows a level back stake on the same runners, and a note to tell you.
Recovery plans can look exciting. They can also dig a deep hole. Raising your stakes to win back losses is called chasing losses. It’s one of the warning signs of problem gambling. Look at the longest losing run and the biggest drop in the bank before you go near them with real money.
Saving, sharing and links
Save a system, then come back later to see how it has done. You don’t need to watch it every day. Give it a name you’ll still recognise in six months. You can add a short comment, such as “Lay the favourite, flat only”.
Tick “Share this system” if you want other members to be able to open it. Shared systems show “shared” in the list.
Once a system is saved, two links appear:
- The Browser link opens today’s selections in a new tab. You can bookmark it for the morning.
- The Bot Link is for a betting bot that accepts it. The bot then finds today’s runners from your saved rules.
Keep these links to yourself. They include your member id. If you want to share a system, use “Share this system” instead of handing out the link.
Export your results
Every member can export results as a CSV file. A CSV file opens in a spreadsheet, such as Excel. You can export up to a year of results, plus one extra column of your choice. Or you can export today’s selections only.
Themes, and a few warnings
You can change the colours with three buttons: Green (the usual look), White (plain and bright) and Dark (light writing on a dark background). The app remembers your choice on that computer or phone.


The app also shows yellow warnings when something will not work the same way in a betting bot. A bot has to bet before the race starts, so it cannot use the BSP. If you set a BSP price range, you’ll see a clear note that the range is not sent to the bot.
Membership
Every member gets the full PR Ratings V3 software. There are no cut-down versions. Every card and every feature above is included for the time you have paid for.
The 12-month plan also includes Auto Bot and the Scoring Power Tool. You find them in the members area. The monthly plan doesn’t include them.
Free video course
Get the free 7-part “How to create a System” videos
One short video a day, by email. I show you how I build a racing system, step by step, in PR Ratings V3. It’s free, and you can unsubscribe at any time.
The sign-up form is loading. If you can’t see it, email malcolm@bluebelldata.co.uk with “Free videos” and I’ll send them to you.
You must be 18 or over. Bluebell Data (PR Ratings) will use your email to send you these free videos and, from time to time, emails about PR Ratings. You can unsubscribe at any time with the link in every email. See our privacy policy. We’ll send a confirmation email first. Please click the link to start the videos.